The TRUTH? η = 1 – (Qc / Qh) = 1 – (Tc / Th)

Discussion on Stirling or "hot air" engines (all types)
VincentG
Posts: 631
Joined: Tue Feb 21, 2023 3:05 pm

Re: The TRUTH? η = 1 – (Qc / Qh) = 1 – (Tc / Th)

Post by VincentG »

Hey, this looks like a trick question...

70 units of heat go to room since 30% eff was already given BUT this would assume that engine requires multiple cycles (rpm) to achieve said work.

I think I see where you're going, but if mass was lifted within 1/2 cycle (just expansion process) then engine would appear 100% eff and no heat would go to room..
Nope not a trick question, genuinely curious. And I should have stated a running cyclical engine.

I tend to believe that in a piston engine, heat is largely not converted to work and that it does infact flow through the engine, if work is being done. But with no external "shaft" work, the "work" is essentially done on the gas itself (in decaying molecular motion) and heat then is converted, like in a stirling cooler. The engine is being driven, so all work is done on the gas.

There were, IMO, some major flaws in Joules experiments, like in the paddle experiment to give equivalents between mechanical work and heat. It certainly established equivalents, but arguably not accurately.

A pv chart does also show load. Without restriction there is no pressure, so the larger the load the larger the area of the pv plot. You just need multiple pv plots under various loads for a given engine to determine this.
Tom Booth
Posts: 3347
Joined: Tue Nov 07, 2006 2:03 am
Location: Fort Plain New York USA
Contact:

Re: The TRUTH? η = 1 – (Qc / Qh) = 1 – (Tc / Th)

Post by Tom Booth »

VincentG wrote: Mon Apr 15, 2024 3:47 am ...
I tend to believe that in a piston engine, heat is largely not converted to work and that it does infact flow through the engine, if work is being done.
.....
After what must have been several years of reading all kinds of conflicting views and theories spanning centuries, I didn't know what to think, and never cared one way or the other what theory or who's theory might be right.

What was the experimental evidence?

Mostly everything I read said there was no experimental evidence relating to the Carnot theory because it would be impossible to build an actual Carnot engine.

Well, to me, if true, that's a red flag smacking of actual "pseudoscience" based on Popper's principle of falsifiability.

But, we have an actual mathematical equation that, based on the Carnot principle, or some Kelvin-esque derivation therefrom, purports to inform us of exactly how much heat we should be able to find being "rejected" from a "perfect" Carnot engine.

A real engine, being LESS efficient than a theoretical Carnot engine should be found to "reject" MORE "waste heat" than a Carnot engine.

So, measuring the heat being "rejected" from a Stirling engine, we could determine which theory was correct.

At no time should we find LESS heat being rejected from a real engine than predicted by the Carnot efficiency formula for a Carnot engine, since a Carnot engine is supposed to be more efficient, it would always produce less "waste heat" than any real engine. If the Carnot equation and general theory or "LAW" is correct a real engine will always reject MORE waste heat than the formula predicts for a Carnot engine.

Numerous sources for how to calculate the expected heat "rejected" to the "cold reservoir" for a Carnot engine can be found in abundance. There seems to be no controversy about that

In no case whatsoever, if the Carnot limit theory and formula are true, should we find NO HEAT WHATSOEVER being rejected to the "cold reservoir" or "sink" for ANY REAL engine.

Experimentally, however, that appears to be the case.

In all my experiments scarcely any heat at all can be found leaving the cold side of my model Stirling engines and in some instances NO heat could be detected. In a few instances the cold side appeared, by my temperature measuring instruments, to actually get a degree or two COLDER than the ambient "cold reservoir".

This is supported by this alleged graph showing actual temperature readings from a real engine
:
Carnot-efficiency-falsification.jpg
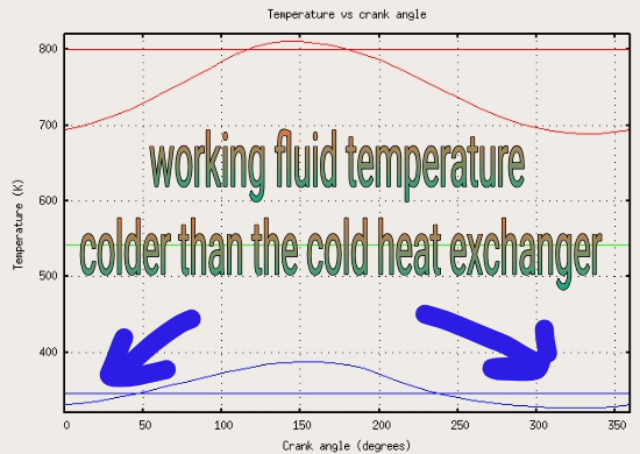
Carnot-efficiency-falsification.jpg (186.09 KiB) Viewed 221 times

So, it appears from such temperature readings, that such experimental results (cooling of the working fluid BELOW the temperature of the sink) is not impossible.

There is abundant additional evidence from various fields that further support these conclusions.

Gases compressed and then expanded in an engine so to convert heat into work, in this way removing heat is the basis of many industrial processes: air-cycle (cryogenic) refrigeration, gas liquefaction etc.

So, my disinterested, unbiased conclusion is, the Carnot formula is invalid

Joule's results were correct.

Tesla was correct.

I have no steak in the outcome one way or the other. Just trying to resolve a debate that has gone unresolved for two centuries already.

I agree, and have stated many many times that my experiments are far from perfect and cannot be considered conclusive. The results should be checked and rechecked and the experiments should be conducted by other researchers and scientists with better, more accurate instrumentation.

I posted the results, or apparent results to the various science forums, inviting criticism and expert opinion, in hopes that some might replicate, or at least attempt to replicate such experiments.

Instead I'm attacked and perma-banned, for seeking some semblance of "peer review". Though not considering myself in any way a "peer" to the university professors or whomever. I just humbly requested some feedback from some "experts" in the field of thermodynamics and such.

I did not even know if the results were necessarily unusual. Should ice melt more slowly when running a Stirling engine, because SOME of the heat is converted to work, so there is LESS heat available to melt the ice?

Seems like a sensible experiment that could yield important data.

Is the heat converted? Does it "disappear" inside the engine or pass through to the ice?

A very simple, logical, common sense experiments ANYONE can perform at their own kitchen table.

Well, my result was that the ice melted more slowly. The ice lasted longer when running a Stirling engine. It appears that LESS heat is passing through. At least SOME heat is being "consumed" or "disappears".

Ahhh!!!!!!

perpetual motion!!!!!!

A Tesla nut!!! Lock the thread, ban him from the forum!!!
Tom Booth
Posts: 3347
Joined: Tue Nov 07, 2006 2:03 am
Location: Fort Plain New York USA
Contact:

Re: The TRUTH? η = 1 – (Qc / Qh) = 1 – (Tc / Th)

Post by Tom Booth »

I fist proposed the comparative engines running and not running on ice here:

viewtopic.php?p=3951

And included this illustration:
tesla-test.gif
tesla-test.gif (6.66 KiB) Viewed 214 times
One prediction of the outcome was:
The experiment is worth trying, but my bet would be that the ice would melt fastest under the left hand engine, the working engine is actively converting heat into energy, and in the process transferring the unused (90% +) heat to the cold side
A reasonable assumption if the Carnot theory were correct.

However, IMO there would be 10% of the heat going towards "converting heat into energy" so maybe the ice might melt 10% slower, if kept well insulated. That would not necessarily invalidate the Carnot theory. The ice would have to melt a LOT slower to be significant.

In my experiments the ice melted about just 15% slower while the engine was running vs not running.

Not really a significant result IMO. It could be interpreted as validating the Carnot limit, which in that experiment was nearer to 20% if I recall

It did seem to confirm at least that SOME heat was being converted and that LESS heat was passing through to the ice for the running engine.

So, it is at least possible to gather some empirical data relating to this Carnot efficiency question. Why not pursue it (the line of experimentation) further?

Did I need better insulation?

I posted the idea in 2012 and didn't actually carry out the experiment until about 10 years later. I wasn't really that interested and didn't have the resources in 2012.

I still need to try the back to back experiment, for theoretically "perfect" insulation.

Two engines running with the ice between the two cold plates. That should eliminate most of the potential infiltration of the surrounding ambient heat getting to the ice without passing through the engines.
matt brown
Posts: 496
Joined: Thu Feb 10, 2022 11:25 pm

Re: The TRUTH? η = 1 – (Qc / Qh) = 1 – (Tc / Th)

Post by matt brown »

VincentG wrote: Mon Apr 15, 2024 3:47 am
A pv chart does also show load.
indeed
VincentG wrote: Mon Apr 15, 2024 3:47 am Without restriction there is no pressure, so the larger the load the larger the area of the pv plot.
Outstanding conclusion !!! For a simple piston PV plot, what Tom is missing is that PV variations are the load. For an ideal Stirling cycle (ideal PV)

(1) if piston at TDC has load force equal gas force then nothing happens (engine stalls) since any isothermal expansion would lower gas pressure whereby gas force is less than piston force

(2) but isobaric expansion would move piston towards BDC, albeit with a continual increase in input temperature

(3) however, if gas force is greater than piston force at TDC, then piston approaches adiabatic expansion

In all 3 cases, PV plots indicate work done without voodoo. An obscure takeaway here it that any isothermal or adiabatic expansion will require a variable load (yield variable work) across each cycle (rpm).
VincentG wrote: Mon Apr 15, 2024 3:47 am You just need multiple pv plots under various loads for a given engine to determine this.
very astute...
matt brown
Posts: 496
Joined: Thu Feb 10, 2022 11:25 pm

Re: The TRUTH? η = 1 – (Qc / Qh) = 1 – (Tc / Th)

Post by matt brown »

Tom Booth wrote: Mon Apr 15, 2024 7:53 am
So, it appears from such temperature readings, that such experimental results (cooling of the working fluid BELOW the temperature of the sink) is not impossible.
Yes, Tlow can fall below T sink and Thigh can rise above T source, but not much. Note how slight this is on the graphic you posted vs source and sink values. I found similar "obscure" rise and fall graphically around similar T values but with similar V values around 2:1 vs ~40:1 LTD.

LTD values are so small that PVT values are irrelevant. All that really matters is cluck:buck ratio (heat in vs power out). In this electronic age, simply mess around with measuring mechanical output...
Tom Booth
Posts: 3347
Joined: Tue Nov 07, 2006 2:03 am
Location: Fort Plain New York USA
Contact:

Re: The TRUTH? η = 1 – (Qc / Qh) = 1 – (Tc / Th)

Post by Tom Booth »

Right, so here is your typical Carnot cycle PV diagram:
Carnot_cycle_p-V_diagram.jpg
Carnot_cycle_p-V_diagram.jpg (45.71 KiB) Viewed 199 times
Perhaps one of you guys can determine the external load or shaft work output for this PV representation and explain how you arrived at that determination or value for mechanical torque, watts generated or whatever.
Tom Booth
Posts: 3347
Joined: Tue Nov 07, 2006 2:03 am
Location: Fort Plain New York USA
Contact:

Re: The TRUTH? η = 1 – (Qc / Qh) = 1 – (Tc / Th)

Post by Tom Booth »

OK, well, suppose we all watch this video:

https://youtu.be/aAfBSJObd6Y

What is the taking away and replacing of the "pebbles" supposed to represent?

This seems to be essential to the operation of the engine but in the real world people don't remove weights from the piston in their engine to allow the working fluid to expand, or put the rocks back again. So what if anything do the rocks actually represent?
matt brown
Posts: 496
Joined: Thu Feb 10, 2022 11:25 pm

Re: The TRUTH? η = 1 – (Qc / Qh) = 1 – (Tc / Th)

Post by matt brown »

The rocks are the load. In this Khan video (by Sal himself many years ago) he starts off with equal and opposing forces, then walks us thru isothermal and adiabatic expansions before finishing off his Carnot cycle with similar isothermal and adiabatic compressions. Most Khan videos are good, but I find most of his thermo videos lacking since he tends to omit crucial details. The problem with this video (like others) is that he dwells on theory and misses reality.

In my previous comment, I mentioned:
---------------------------------------------
An obscure takeaway here it that any isothermal or adiabatic expansion will require a variable load (yield variable work) across each cycle (rpm).
---------------------------------------------
The magic answer is the flywheel where the secret sauce is converting an initial irregular kinetic force into a final regular kinetic force via momentum (and a little inertia). Early steam engines lacked a flywheel and were operated without inlet cutoff. Then some bright boy came along (I forget who) and discovered you could increase efficiency (save fuel) by inlet cutoff if you added a crank and flywheel.
Tom Booth
Posts: 3347
Joined: Tue Nov 07, 2006 2:03 am
Location: Fort Plain New York USA
Contact:

Re: The TRUTH? η = 1 – (Qc / Qh) = 1 – (Tc / Th)

Post by Tom Booth »

matt brown wrote: Tue Apr 16, 2024 12:52 am The rocks are the load...
....
The magic answer is the flywheel ...
Sure.

The flywheel however is only a very small part of "the load". A "reversible" part.

Around 7:00 I think, Kahn mentions that the gas does work putting "potential energy" into the rocks.

The potential energy represented by rocks, is removed to the flywheel and later returned to the working fluid, adding back to the internal energy during "compression".at the end of the cycle.

So this reversible "shaft work" temporarily stored in the flywheel is represented where or how by the PV diagram?

"Under the curve"???

Sources that mention shaft work at all, in relation to PV diagrams project this work to the left onto the Pressure graph side of the PV diagram, not "under'.

But the flywheel is only a tiny portion of the shaft work that is "reversible". Typically, even this small slice of arguably "internal/reversible" shaft work is not represented on a conventional "ideal" PV diagram, and is projected left not under.

Instead we have this rock replacing analogy, because this work of overcoming inertia and putting potential energy into the flywheel is otherwise not represented by the PV chart.

The majority of the external shaft work, to drive an actual external load is "irreversible". Cannot ever be recovered.

But this external work is the principal purpose of an engines existence.

PV diagrams only show "reversible" work, not the actual "useful" external work.

A PV diagram is composed of "state variables". Connect the dot points. RPM is not a "state variables". External work is not a "state variables".

Heat goes in and work goes out and the state of the "internal energy" ∆U = 0

All the actual external work output of the engine is not represented by a PV diagram at all.

So when fool says "zero work", that is not accurate.
Fool
Posts: 252
Joined: Sun Jul 16, 2023 9:14 am

Re: The TRUTH? η = 1 – (Qc / Qh) = 1 – (Tc / Th)

Post by Fool »

Tom Booth wrote:PV diagrams are crap science based on an obsolete theory of heat. They don't indicate the work performed. They indicate "the fall of Caloric".
Please explain how Pressure P, and Volume V indicates "Caloric" ? They don't. Not in any way, shape or form. They are both just, and verified by, measured values. They are idealized for maximum possible effects, power, efficiency. Indicator diagrams of real engines show lower efficiencies.

I visualize power on a PV diagram by use of the Equation P•(V2-V1)=Work. Or P•DV=W.

DV = Delta Volume, the change in volume. Expansion or contraction.

P•V is the area underneath the path of the process and above the P-axis. Between the two If P is constant, it is a rectangular shaped area, V2-V1 wide, and P tall. Understanding that, is very helpful.
Tom Booth wrote:The entire field of thermodynamics developed by Kelvin then, is a return to Caloric theory.
It was realized fairly rapidly, by a few, that for calorics to be conserved, conservation of energy had to be abandoned, unless each caloric contained different values of energy. Temperature of the caloric became those energy levels and conservation of both energy and caloric worked mathematically. What was missing was the calorics. They were replaced by kinetics, vibrations, wiggling.

Today we model thermodynamics using kinetic energy, as no calorics have been found, except infrared photons of various energy levels and frequencies. In kinetic theory, vibrations, wiggling, of known atoms accounts for energy that is measured by temperature. More and faster wiggling equates to higher temperatures. Higher temperature equates to higher energy levels.

For conservation of energy to be kept, temperatures of the working fluid must change. For a cycle, forward work-out and temperature drop, must be larger than return work-in and temperature rize. This is accomplished in every working engine by an increase in internal energy before and during the forward stroke, and a reduction of energy before and during the return stroke. Some adjustments to those two requirements can happen, but, will likely reduce efficiency. Real engines adjust the ideal cycles extensively at the detriment of efficiency.

Work-out reduces the internal energy and must be enlarged by adding energy. Needed for a complete cycle, power stroke.

Work-in adds energy, and is the same as negative-work-out, and must be reduced by removing energy. Needed for a cycle, return stroke.


Reducing the work-in for the return stroke is just as necessary as increasing the work-out for the power stroke.
Fool
Posts: 252
Joined: Sun Jul 16, 2023 9:14 am

Re: The TRUTH? η = 1 – (Qc / Qh) = 1 – (Tc / Th)

Post by Fool »

"under the curve" is a calculus term. In Senft's "effective" work diagram, the work-in, "negative work" is the area shaded between the engines path and the buffer pressure, zero pressure.

In other models it is the area between the path/curve and zero, x-axis.
Fool
Posts: 252
Joined: Sun Jul 16, 2023 9:14 am

Re: The TRUTH? η = 1 – (Qc / Qh) = 1 – (Tc / Th)

Post by Fool »

VincentG wrote: Fri Apr 12, 2024 7:14 am There is so much misinformation online, it makes it very hard to use common language unless you are classically trained. Even then there is likely confusion.

Fool here is a question for you.

Suppose an engine is in a perfectly insulated room. The engine is exactly 30 percent "efficient". We send 100 units of heat energy to a perfectly insulated engine running under full load to lift a mass within the room. How many units of heat will go on to heat the room?
Assuming a room is a large construct, 70 Joules into it won't change the room-atmosphere's temperature much. It may not even be measurable.

A 70 Watt lightbulb will heat a room in a house, how much? How hot will the room need to be, with
a much larger surface area to outside, to dissipate 70 Watts? Can you run a Stirling Engine on a 70 Watt 300 F heat source and a 68 F room? Yes

Can you run a Stirling Engine on a 68.000 F room and a 68.001 F outdoors? Nope. At least no one has.

Differential temperature equates to maxim differential pressure. I know you know that. It's hard to be efficient on 1/1000'ths of a psi. More friction and weight than force, and that's after the Carnot Theorem gets done robbing it.

Good question.
matt brown
Posts: 496
Joined: Thu Feb 10, 2022 11:25 pm

Re: The TRUTH? η = 1 – (Qc / Qh) = 1 – (Tc / Th)

Post by matt brown »

The enclosed work area of PV plot represents all work done by "system" on "surroundings" so the work area includes shaft work, flywheel 'work' that returns during compression and work against buffer pressure, friction, etc. PV plots are rather crude, but all they had in the old days. My major PV issue is that most are drawn inaccurately as if to con investors. My minor PV issue is no indication of energy per process, so they're rather limited. Some info we can glean at a glance with experience, but most energy values still require calcs.

The basic engine scheme has all shaft work pass thru flywheel, not just the work that returns during compression. The average flywheel holds many times more energy than each engine cycle (rpm) which is why most are relatively large. However, due to how the math plays out (kinetic vs momentum) a faster running engine can have a relatively smaller flywheel while a slower running engine will require a relatively larger flywheel (think old world steam engines).

PV plots might show reversible work but this might not qualify as a reversible process. I remember Fool saying zero work, and it seemed all wrong, but I never got back to that comment (limited time lately).

With typical 4 process PV, all area under the upper curve is Wpos all the way down to zero-zero (0k and 0 pressure) but most PV scales are truncated above this. Likewise, all area under the lower curve is Wneg all the way down to zero-zero. Go back and check the Geogebra PV plot I posted recently and look carefully at the apex of PV scales where the apex is zero-zero. This is the hallmark of accuracy, and you can't fudge work proportions with this apex.
Fool
Posts: 252
Joined: Sun Jul 16, 2023 9:14 am

Re: The TRUTH? η = 1 – (Qc / Qh) = 1 – (Tc / Th)

Post by Fool »

Agreed. My zero work comment is for the ideal case where expansion work equals compression work. It also could be for any pair of processes that exactly follow the same path for both expansion and compression, a cycle of zero area. It would be just a line with zero enclosed area. Zero for the complete cycle.

If anyone wants to talk adiabatics, the only way off an adiabatic line is to add or subtract heat. To get an enclosed area with adiabatics heat must be added before the expansion thus in a higher adiabatic line. And heat must be removed before the return stroke, thus on a lower adiabatic line. That is necessary for separating the lines for an enclosed area. The adiabatic temperature drop stays on one adiabatic line, it is not "cooling".

There can be no enclosed area without adding and subtracting heat. Adding and rejecting/subtracting heat is how the area gets enlarged. Both are needed for a complete cycle.

Draw any enclosed cyclic path grater than zero area on a PV diagram, and it will cross over more than one adiabatic line more than once. That will indicate a necessary heat addition and heat rejection.
Tom Booth
Posts: 3347
Joined: Tue Nov 07, 2006 2:03 am
Location: Fort Plain New York USA
Contact:

Re: The TRUTH? η = 1 – (Qc / Qh) = 1 – (Tc / Th)

Post by Tom Booth »

The essence of "Caloric theory" is that "the fall of Caloric" (temperature change) is the only metric and that without that there is zero work, zero efficiency.

Such a view is based on obsolete, incomplete knowledge.

I could, for example, envisage a "perfect" or "ideal" steam engine based on pressure rather than temperature changes.

Imagine a cylinder containing a liquid (water) at 100°C

By "removing rocks" the pressure drops and some of the liquid changes phase to a gas absorbing heat from a 100°C "reservoir" doing work lifting the piston in an isothermal process. I continue removing rocks to effect phase change to compensate for whatever work output.

The "internal energy" of the expanding gas stays constant because any heat input exactly matches the work output.

When the phase change, driven expansion has continued enough for my liking I start replacing rocks.

As the pressure increases the gas begins to liquify. This process continues isothermally "rejecting" any heat of condensation to the 100°C reservoir at a temperature of 100°C until the piston returns and the original pressure is re-established.

The whole cycle is carried out at 100°C along a single isotherm.

"Work" was performed but because there was no "fall of Caloric", (no temperature change), someone holding the "caloric theory" mindset that considers temperature change the only thing that matters cannot recognize that any work has been performed. The only thing a PV diagram of this cycle shows is a back and forth motion along a single isotherm.

This is not unlike the Carnot cycle but lacks the adiabatic phases, which in this case are unnecessary.

Another factor neglected when fixated on a "caloric mindset" is forces of molecular attraction and repulsion which have an effect similar to the phase change scenario above.

The whole idea that a change in temperature is the sole consideration in determining "efficiency" is misguided and I think we would all do well and could make better progress if this fallacy could be dispensed with once and for all.

There are, of course, numerous other factors that contribute to engine performance and engine efficiency and the myopic fixation on temperature change inhibits any real progress.

If it doesn't adhere to the expectations of the Carnot "fall of Caloric" theory it is "unscientific', taboo, or "fraudulent".

The only fraud is the "Carnot Limit".
Post Reply